Observation Network
Argo Float Coverage: California Current System
Sparse by design; void ratio quantified before modeling to mask unreliable kriged estimates.
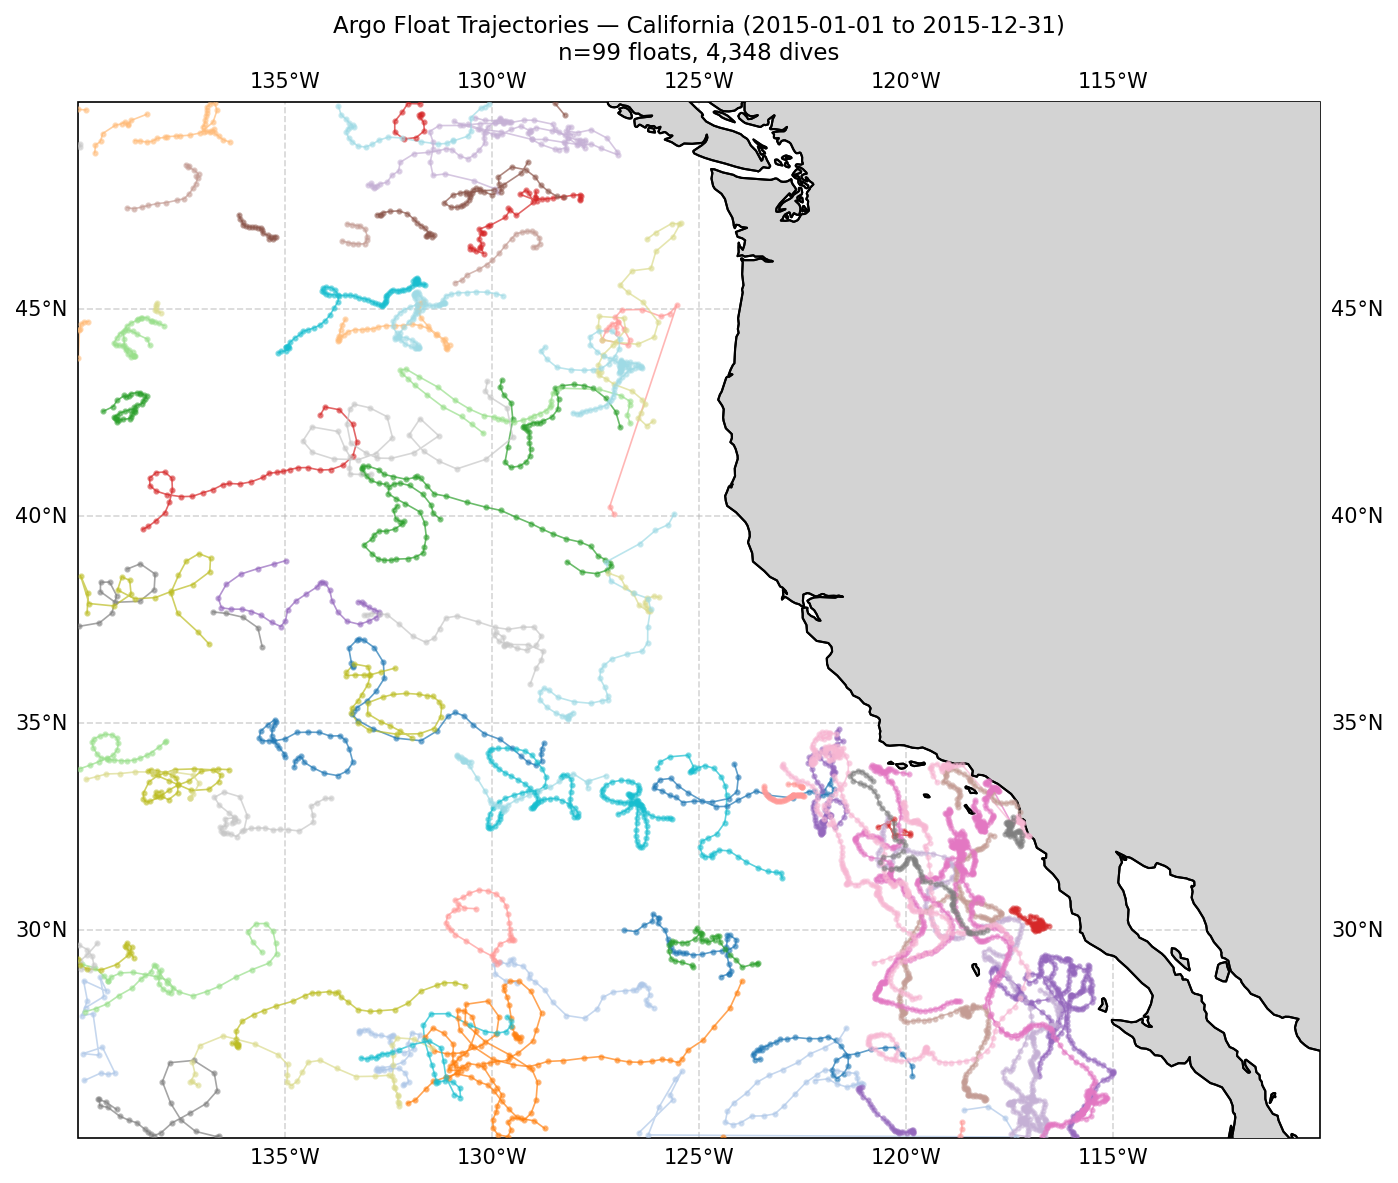
Argo float trajectories across the California Current System bounding box (lat 30–50°N, lon 215–245°E), 2015.
Sparse by necessity
Argo floats are globally distributed; the CCS domain captures tens of active floats per
10-day window, clustered near coastal fronts and the open Pacific. Coverage is uneven but
sufficient for GPR given the kernel's uncertainty-aware interpolation.
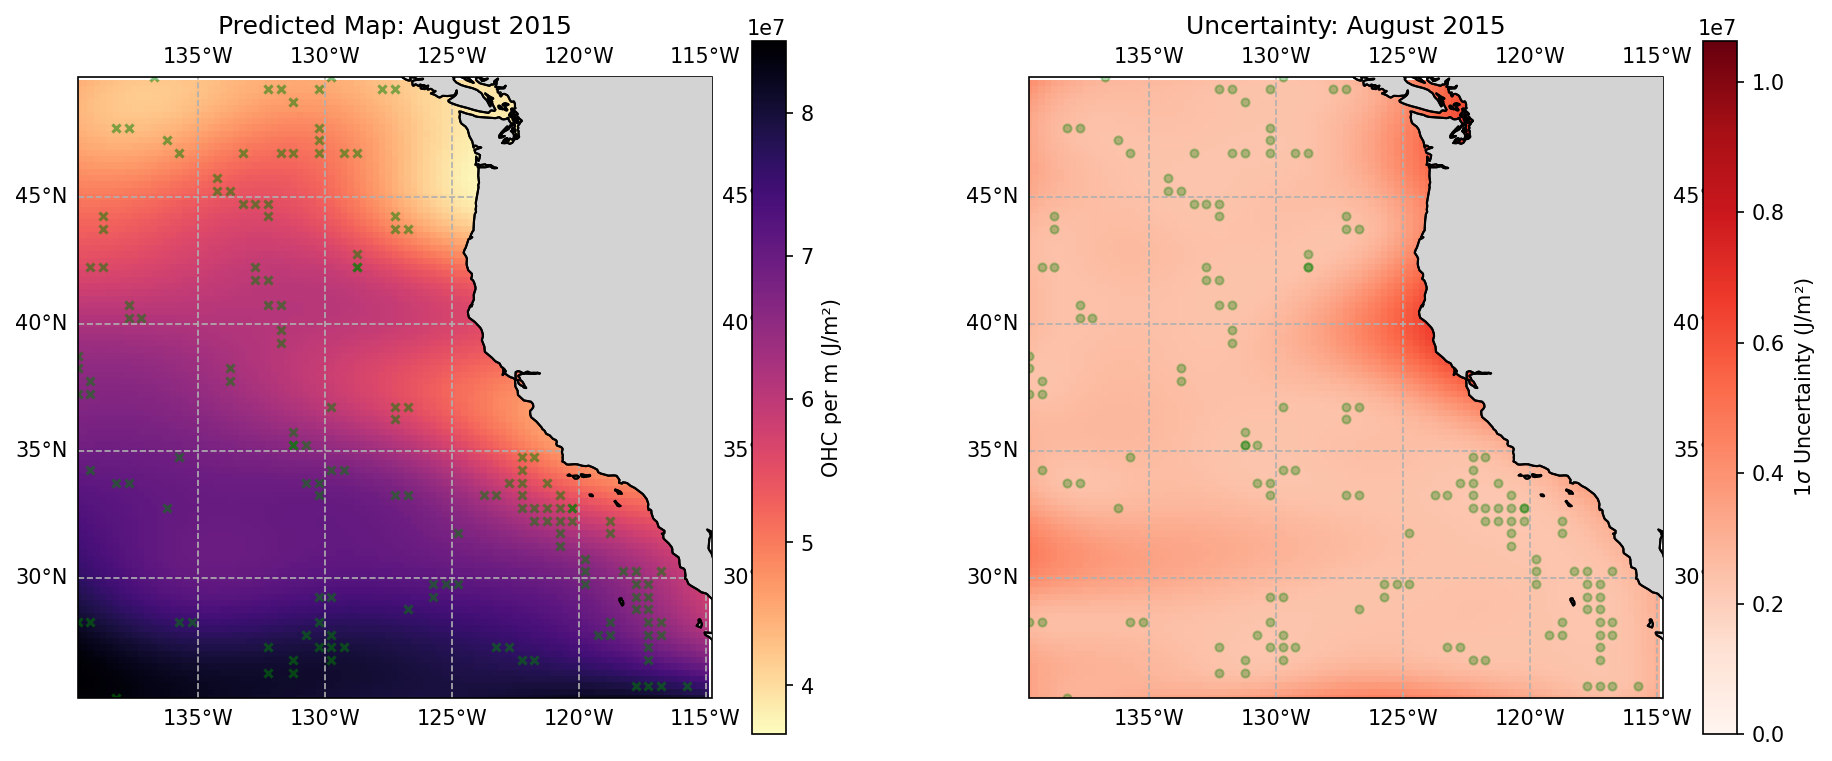
Void ratio
The fraction of 0.5°×0.5° cells with no float observations in a rolling window; cells
above the void threshold are masked from kriged output to prevent extrapolation artifacts.
Domain bounds
Bounding box defined empirically from the long-term float census (1999–2025): cells with
float presence in ≥20 of 26 years anchor the domain, keeping the analysis within the
observationally constrained region.
Depth-aware filtering
Each profile contributes to a layer only if it reaches the layer's minimum depth. A float
descending to 300 m counts toward Skin and Source but not Background.