Marine Heatwave Risk Profiler

Marine heatwave events translate directly into financial losses for aquaculture operators and climate insurers, but the connection between ocean temperature anomalies and dollar exposure has historically been opaque. This project builds that bridge: fusing 90-day atmospheric ensemble forecasts with 3D ocean depth data to translate climatological states (cumulative heat stress, subsurface temperature anomalies) into forward-looking financial risk estimates stakeholders can act on. Google's WeatherNext 2 model generates 64 independent atmosphere simulations per forecast; HYCOM tracks temperature, salinity, and currents at 10 depth levels below the surface. A deep learning model combines both streams, mapping physical ocean conditions to financial exposure across every Gulf of Maine cell up to 90 days in advance. The primary model uses WeatherNext 2, Google's most sophisticated new foundation weather model, with ERA5, the established legacy atmospheric reanalysis, as a comparison baseline.

161 Ocean Cells 64 Ensemble Members 2 Atmospheric Sources 10 Depth Levels 2022–2023 Training Data
v1 RESULTS Preliminary — see roadmap for v2 improvements

Atmosphere + Ocean Simulations to 90-Day Risk

Two years of daily data harmonized to a shared 0.25° grid, stored in Google Cloud.

🌊
HYCOM Ocean
3D temperature, salinity & currents at 10 depth levels
🌬️
ERA5 / WeatherNext 2
Atmospheric data — 64-member ensemble of wind, pressure & temperature
🔗
Harmonize
Regrid to 0.25° · align time axes · interpolate depth
🧠
MHW Model
1D-CNN + Transformer + Attention Gate — one run per cell
📊
SVaR Map
95th-percentile Stress-VaR across 161 Gulf of Maine cells

What is SDD?

Stress Degree Days measure cumulative heat above the historical average — the same concept used by coral reef scientists to predict bleaching. One SDD = one day where ocean temperature exceeds the baseline by 1°C.

Why 64 members?

WeatherNext 2 runs the atmosphere 64 independent ways. The spread of outcomes across those 64 runs is what drives the uncertainty range in our risk estimate — higher spread means less predictable conditions.

SVaR defined

Stress Value-at-Risk is the 95th-percentile outcome across the 64 ensemble members. In insurance terms: "at most 1-in-20 scenarios exceed this level of thermal stress."

1D-CNN + Transformer + LeakyGate

The model processes every ocean cell independently with two parallel information streams — one for depth, one for time — and learns to weight them.

Network architecture — 1D-CNN depth encoder, Transformer temporal encoder, LeakyGate fusion
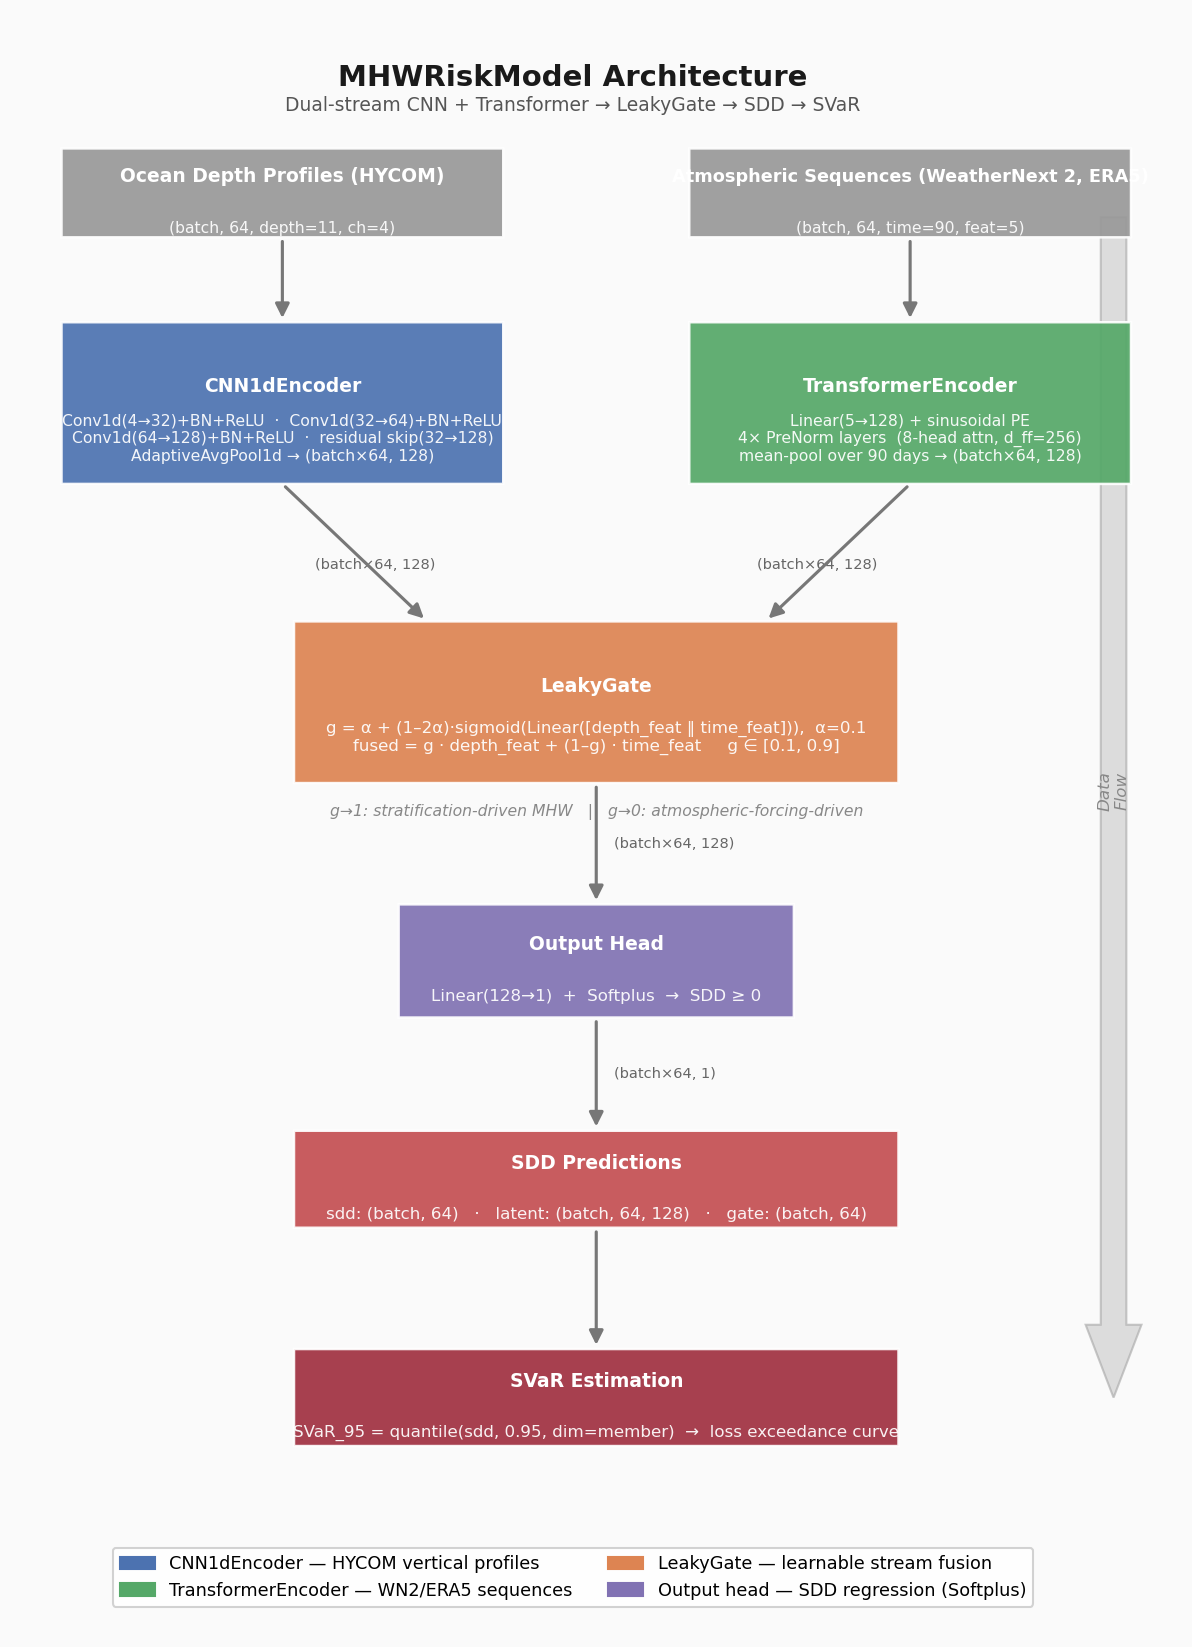
1D-CNN Depth Encoder Reads the ocean's vertical profile — temperature, salinity, and currents at 10 depth levels — and compresses it into a single "ocean state" vector per cell.
Transformer Temporal Encoder Reads the last 90 days of atmospheric data and uses self-attention to find which days and patterns matter most for predicting upcoming heatwave stress.
LeakyGate (α) A learned gate that blends the ocean and atmosphere streams. α → 1.0 means the model trusts the ocean depth more; α → 0.0 means it trusts the atmosphere more. ERA5 converges to α ≈ 0.26 (atmosphere-dominant); WN2 to α ≈ 0.44 (more balanced).
Gaussian Spread Head Predicts both mean SDD and the spread across the 64 ensemble members. Spread quantifies how uncertain the forecast is — a wide spread means the 64 ensemble members disagree.

Convergence & Gate Analysis

Trained on 2022 Gulf of Maine data, validated on 2023. Early stopping halted training when validation loss stopped improving.

Training & Validation Loss
LeakyGate Coefficient (α) — Which Stream Dominates?

Stress VaR Map — Gulf of Maine

SVaR95 [°C·day] — 95th-percentile cumulative thermal stress across ensemble members. Higher values = greater heatwave risk for marine assets.

⚠️ Illustrative map: Inputs are synthetically generated with latitude/longitude-dependent structure to show spatial response. Real-data inference requires the full GCS data pipeline (v2). The model architecture and trained weights are real.

v1 → v2 Improvements

v1 establishes the full pipeline. v2 addresses the core scientific limitations to produce publication-ready results.

v1 — Current What exists now

2-year baseline for MHW threshold (Hobday 2016 requires ≥30 years)
Ocean labels are deterministic across all 64 members — ensemble spread underestimated
Full real-data SVaR inference requires active GCS data access
Model trained on 2 years of data; limited temporal generalization

v2 — In Progress What's coming

30-year OISST v2.1 climatology (1982–2011) for scientifically valid MHW thresholds
GLORYS12V1 ocean reanalysis + stochastic perturbation → real ensemble spread in labels
Full observationally-driven SVaR inference across all 161 Gulf of Maine cells
Extended to 2022–2025 coverage for improved model generalization